Overview
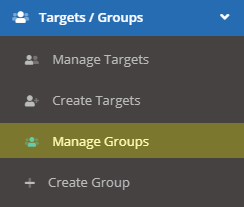
You can get to your Group Details page by going to Targets / Groups > Manage Groups and clicking on the "View" button.

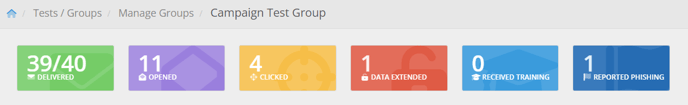
Emails Overview
The top of the Group Details page shows the number of emails delivered and opened, as well as the number of phishing emails for which the targets within the group have clicked links, performed failure actions on the landing pages, completed training, and reported the phishing emails. These numbers are for all tests on that group.
Summary Data and IP Map
The Summary Data section provides a chart with an overview of the past twelve tests. Hovering your mouse over one of the charts will show you the number of emails that had been scheduled, targets included in the test, unsent emails, errors on email sends, bounced emails, delivered and opened emails, number of emails for which a target clicked a link in the email, number of landing pages on which targets performed failure actions (data was extended), number of targets that received training for the test, number of targets that received training, and the net reporter score of the test. You can learn more about some of these terms in our Phishing Term Appendix article.
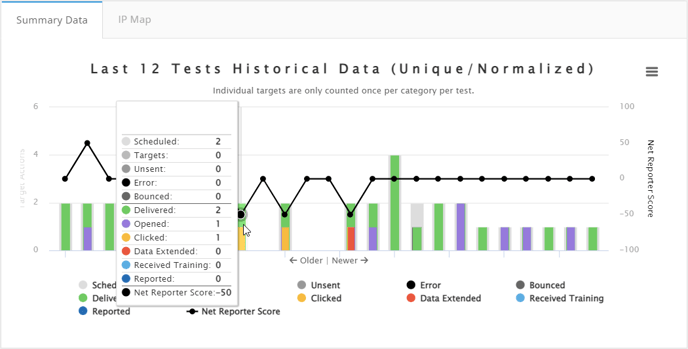
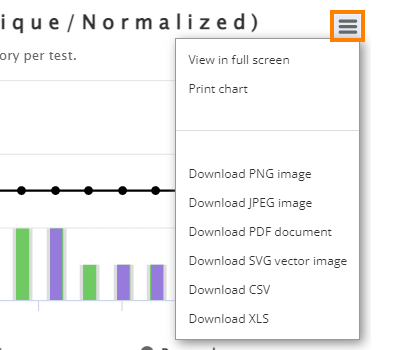
The menu button to the right of the charts allows you to view the charts in full-screen, print the charts, download the charts as PNG, JPEG, PDF, SVG, CSV, or XLS files.
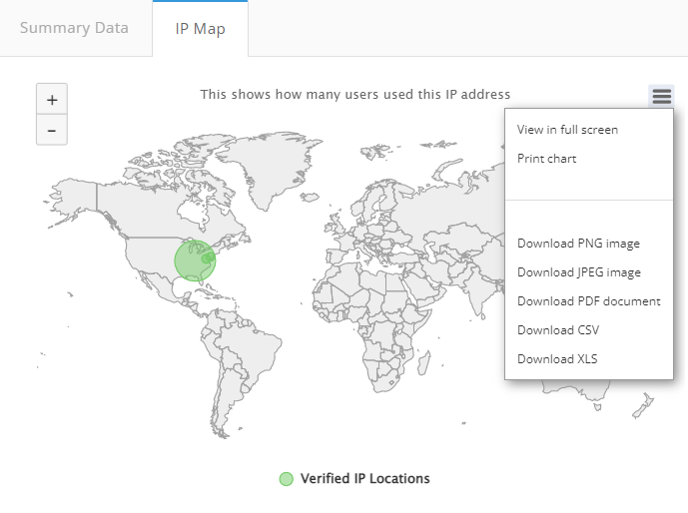
The IP map shows the locations of the IP addresses performed by the targets within the group for the past twelve tests. You have the ability to view this map in full-screen mode, print the chart, or download it. You also have the options of viewing the IP addresses in data table format and of opening the map in Highcharts Cloud.
Group Details
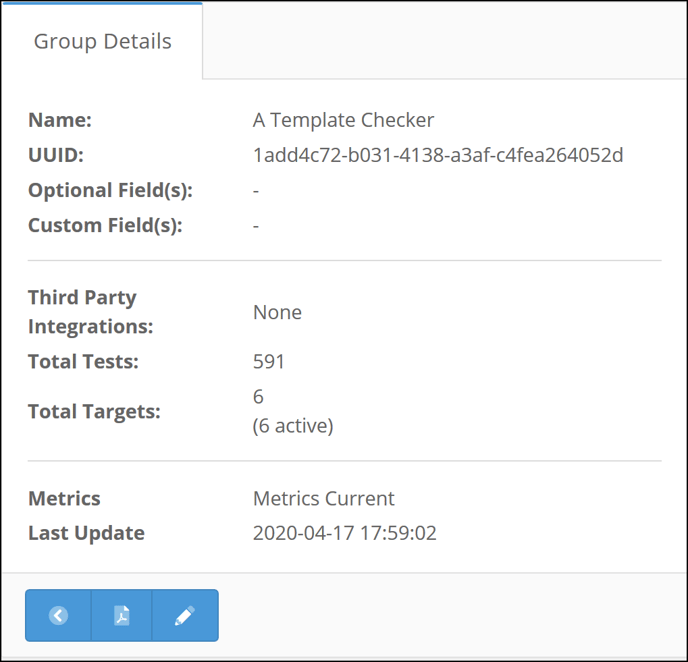
The Group Details section shows you the name of the group, its UUID, optional and custom fields associated with the group, third party integrations set up for the group, number of tests performed on the group, number of targets within the group, metrics status, and last time the metrics were updated for the group.
At the bottom are three icon buttons: the back button, which will take you back to the Manage Groups page; the Report Generator button, which will generate a report on the group; and an edit button, which will take you to the Edit Group page and allow you to edit the group's name, integration settings, custom fields, default courses, and authorized users.
Tests
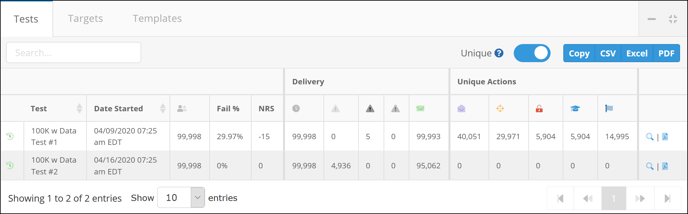
The tests section shows all the tests performed on the group. The green icon on the below image tells you the status of the metrics. You have columns showing the test name, date started, number of targets included in the test, fail rate (as a percentage), NRS score, emails scheduled/unsent/errored/bounced/delivered/opened, number of links clicked in emails, landing page failures, training received, and phishing emails reported. There is a magnifying icon button to the right of these columns, which will take you to the Test Details page for that test. There's also a Report Generator button, which will generate a report on that test. The Unique button, when turned on, will count only unique actions performed on the tests (for example: if a target opened an email three times, then it would count only once in the email opened column; if this button were off, then the email opens performed by this target on the specific email would be counted three times). The Copy button allows you to copy the data to your clipboard. The CSV, Excel, and PDF buttons allow you to open or download the data in the associated file types.
Targets
The targets section provides information on the targets within the group. There is a metrics column on the far left of each target row, which tells you if the information is up-to-date on that target. There are also name, email, target status, group status, tests included in data, emails delivered/opened, links clicked, data extended, training received, and phishing emails reported columns. In the far right column are the View Target Details and Generate Target Report icons. You may copy all the target information on the page to your clipboard by clicking on the Copy button. You can download or open the information in CSV, Excel, or PDF files by clicking on the appropriate button in the top-right of the targets section.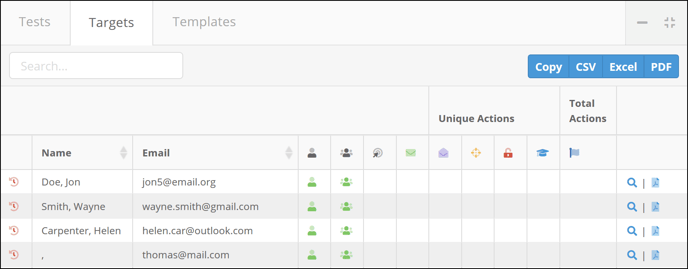
Templates
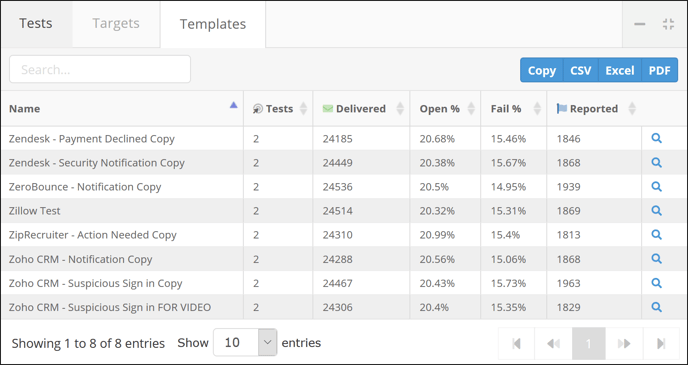
This section shows the templates that have been used in phishing tests on the group. It shows the template name, number of tests the template has been used in for that group, the number of emails delivered, percent opened, percent failed, and the number of times targets within that group have reported that template as phishing. Clicking on the View Template button in the far right column will take you to that template. You may copy the template information displayed on the page to your clipboard by clicking on the Copy button. You can download or open the information in CSV, Excel, or PDF files by clicking on the appropriate button in the top-right of the templates section.
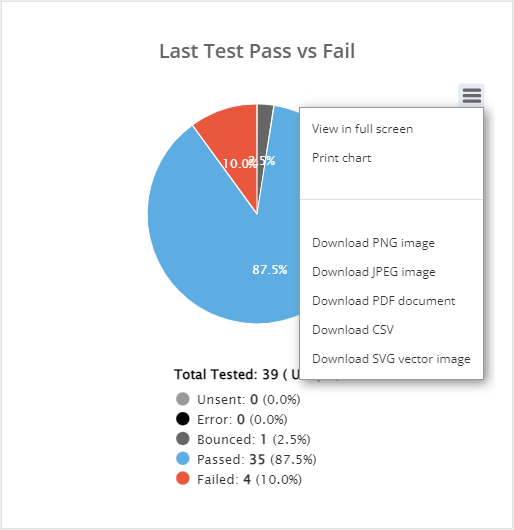
Last Test Pass vs Fail
This section provides an overview of the last test by email sent. It shows the percent and number of emails unsent, bounced, and errored, as well as the pass/fail rate. You can view the chart in full-screen mode, print the chart, download as PNG, JPEG, PDF, CSV, or SVG file.