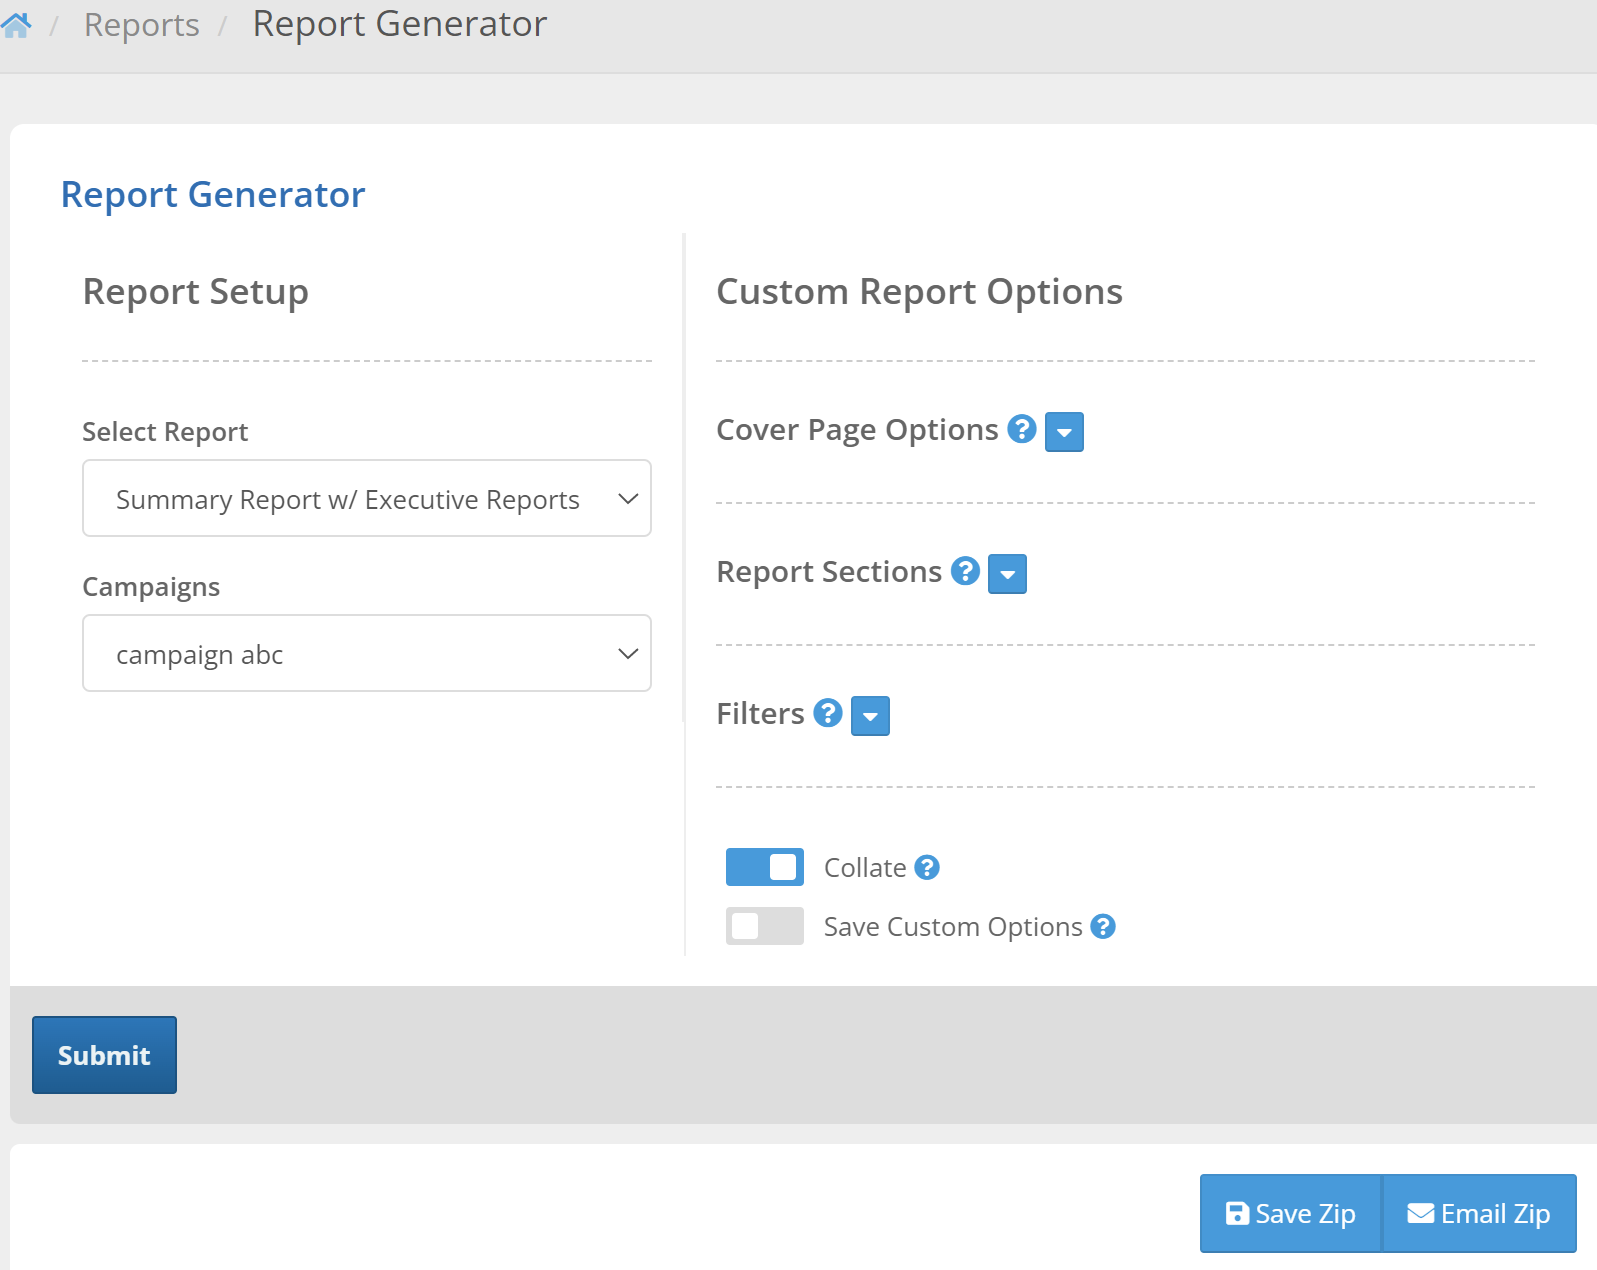
Navigate to Reports > Report Generator.
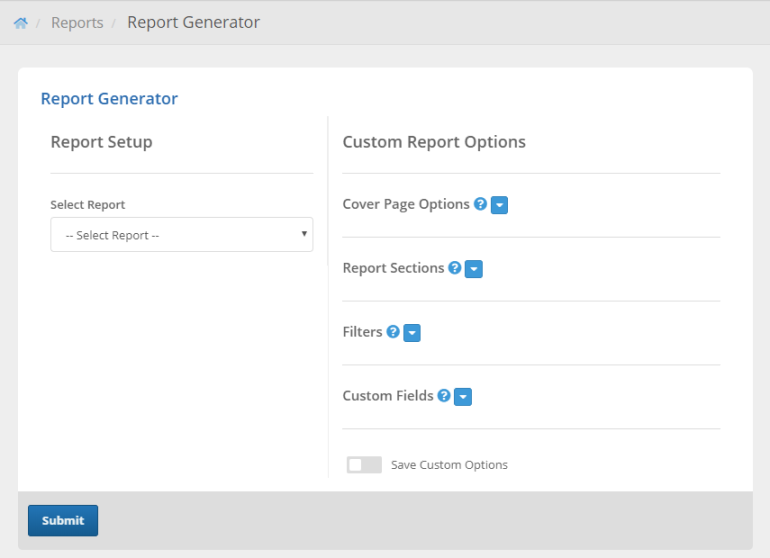
This will open the Report Generator page.
To generate a report:
- Select Report
- Cover Page Options
- Report Sections
- Filters
- Custom Fields
- Collate
- Save Custom Options
- Post-Report Generation Options
- A Note About Flattened Data
Select Report
Pick the report you want to generate by using the 'Select Report' select menu. Choose a data set to report by, e.g., campaign, group, or target, and the type of report. The various report types are described below.
- Note: All report types can be customized, the user may enable or disable report sections as desired.
There are several report types available.
- By Campaign - Select specific campaigns for reporting. Reports by campaign will only allow one campaign per report.
- Summary Report - A quick summary of a campaign. This report includes the 'Campaign Summary' section which provides the campaign details, failure activity breakdown pie chart, campaign action breakdown by test, and campaign pass/fail breakdown by test.
- Summary Report w/ Executive Reports - Includes the summary report along with reports on any tests included in the campaign.
- By Course - Generate reports for selected courses.
- Enrollment Report - Course and program reports include enrollees, progress, and dates started and completed.
- By Group - Generate reports for selected groups.
- Summary Report - A quick summary of a group's phishing testing. Includes the group details, failure activity breakdown pie chart, last 12 tests action historical data, and last 12 tests pass/fail historical data.
- Summary Report w/ Actions - Includes the group summary report along with the groups action breakdown table. (Will only print if there are less than 2500 targets plus actions in the group due to browser constraints).
- Summary Report w/ Metrics - Includes the group summary report along with the group's historical test data, group's target metric data, and a group course summary. (Will only print if there are less than 2500 targets in the group due to browser constraints).
- Summary Report w/ Executive Reports - A group summary that includes test executive reports for all tests on the group.
- Summary By-Date Report - Filter a group summary with a date range.
- Date Comparison Report - A group summary that compares testing activity between two distinct date ranges.
- Repeat Offender Report - A report showing targets in a group who have failed multiple times for the specified date range.
- By Target - Generate reports for selected targets. Select a group to populate the target lists, after which you can select targets. Move the targets for which you wish to generate reports into the 'Selected' field.
- Individual Report - Includes a target summary and a target course summary. The target summary includes a passed vs. failed pie chart for tests taken, most severe actions chart, breakdown by test, actions taken on test emails, an IP map, and an IP summary. Each target selected will generate an additional target summary and a target course summary.
- Individual By-Date Report - Identical to the Individual Report, but you can select a date range to report only tests, actions, and course activity that have taken place within the given date range.
- By Template - Report metrics for an account's templates. Useful for comparing template effectiveness on a template-by-template basis.
- Summary Report - Includes the number of tests in which the template has been included, the number of times the template has been sent as a phishing email, failure percentage, and report percentage.
- By Test - Generate reports for a single test or a group of tests. Test 'Executive Reports' can be included in a number of the other report types. Reporting by test allows you to filter test metrics based on target details including but not limited to department, city, and state. When you select a By Test type report, you'll be able to generate the report for phishing tests as well training tests.
- Executive Report - A simple test report. This includes the test details, the test's Net Reporter Score, a quick test summary that includes the number of messages sent and failures at a glance, passed vs. failed pie chart, most severe action pie chart, test results, received training pie chart and failed received training pie chart.
- Full Report - An executive report that includes a test comparison summary if multiple tests are selected, and a training summary if selected tests included course auto-enroll.
- Exhaustive Report - A full report that includes a test action summary and template details. The test action summary will only be included if there are fewer than 2500 actions on a test due to browser constraints.
- Failed Only Report - Includes a failed-only test summary, test comparison summary if multiple tests are selected, and test action summaries for tests with less than 2500 actions. Failed only reports filter out all actions that are not failures from reported metrics.
- Actions Report - Includes a table containing a list of actions with their date, time, action type, IP address, browser and OS.
Cover Page Options
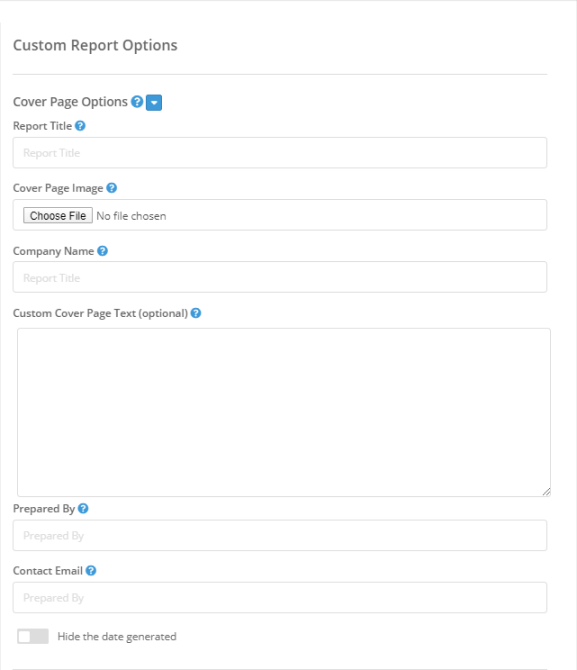
These options allow you to make changes to the PDF cover page when you generate the report.
Report Title
The report title is generated by default based upon the report type and data. However, if you wish to enter your own title you can do so here. This title will appear on the cover page and file name.
Cover Page Image
Upload an image that will display as a cover page header.
Company Name
Insert a company name that will be displayed on the report's cover page.
Custom Cover Page Text
This is custom text that will appear on the cover page of your report when it is generated as a PDF. You can use paragraph, break, bold, and italic HTML tags. All other tags will be stripped.
Prepared By
The name of the user who generates the report.
Contact Email
The email address of the user who generates the report.
Hide the date generated
By default, the date and time the report is generated will appear on the cover page of the PDF. However, if you wish to hide this date check this box.
Cover Page Logo
A cover page company logo can also be configured on the Branding Settings page.
Report Sections
Report sections can be enabled or disabled at will. Different types of reports will contain different reporting sections. For descriptions of the sections available for different types of reports, see the Select Report section above.
The 'Phishing Term Appendix' is included in all reports by default. The appendix lists any phishing specific terms that may be useful for interpreting the report data. Different phishing templates will generate different terms. Not all phishing templates will hit the same endpoints or lead to the same conclusions. E.g., some phishing emails require report-by actions, some will lead to hook URLs. Every campaign is different and will generate different phishing terms. For more information, see our Phishing Term Appendix.
The 'Hide Annotations Section' switch will enable or disable the annotations sections of reports. Annotations provide additional metadata related to the report, including whether phish domains were flagged by search providers while a test was ongoing.
There will be many optional sections to include in each report type. The sections below will breakdown the reports by their groups and describe the available section toggles.
By Campaign
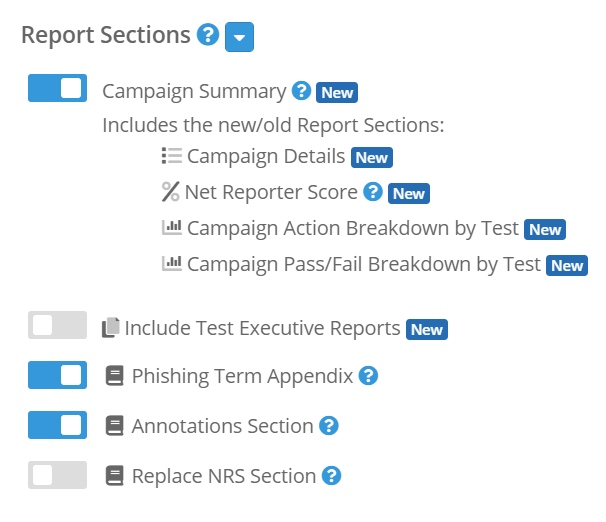
- Campaign Summary - This section gives a brief summary of the data for the campaign.
- Include Test Executive Reports - This section gives a summary of the most severe actions and pass fail data.
By Course
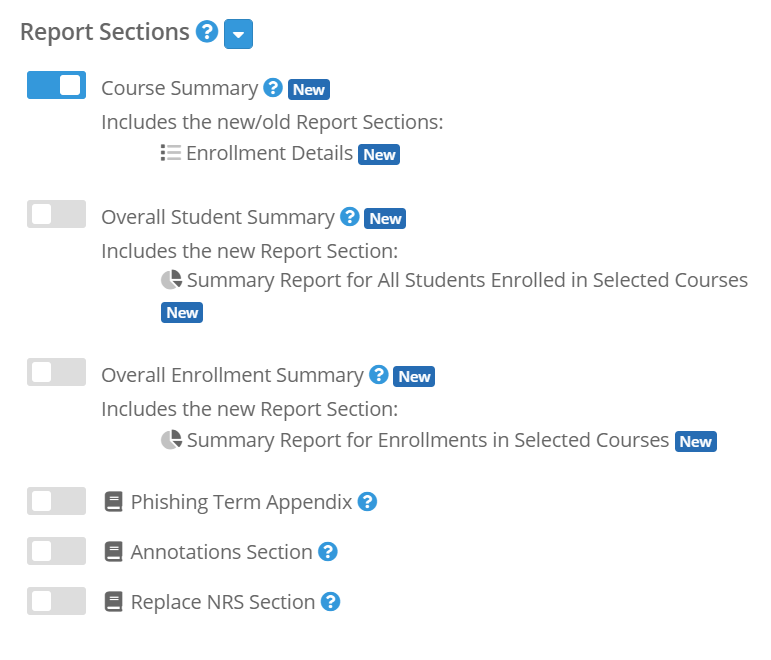
- Course Summary - This section gives a brief summary of the enrollment data for the selected course(s).
- Overall Student Summary - This section gives an overview for all the students enrolled in the selected courses. The data is aggregated by student, where it shows the total number of students enrolled in the selected course(s), total number of students that have not started any coursework and are not overdue in any coursework, total number of students that have at least one in-progress course and are not overdue in any coursework, total number of students that have completed and passed all assigned coursework, and number of students with at least one overdue course.
- Overall Enrollment Summary - This section gives an overview for the enrollment statuses for all selected courses.
By Course Program

- Course Program Summary - This section gives a brief summary of the enrollment data for the course program.
By Group
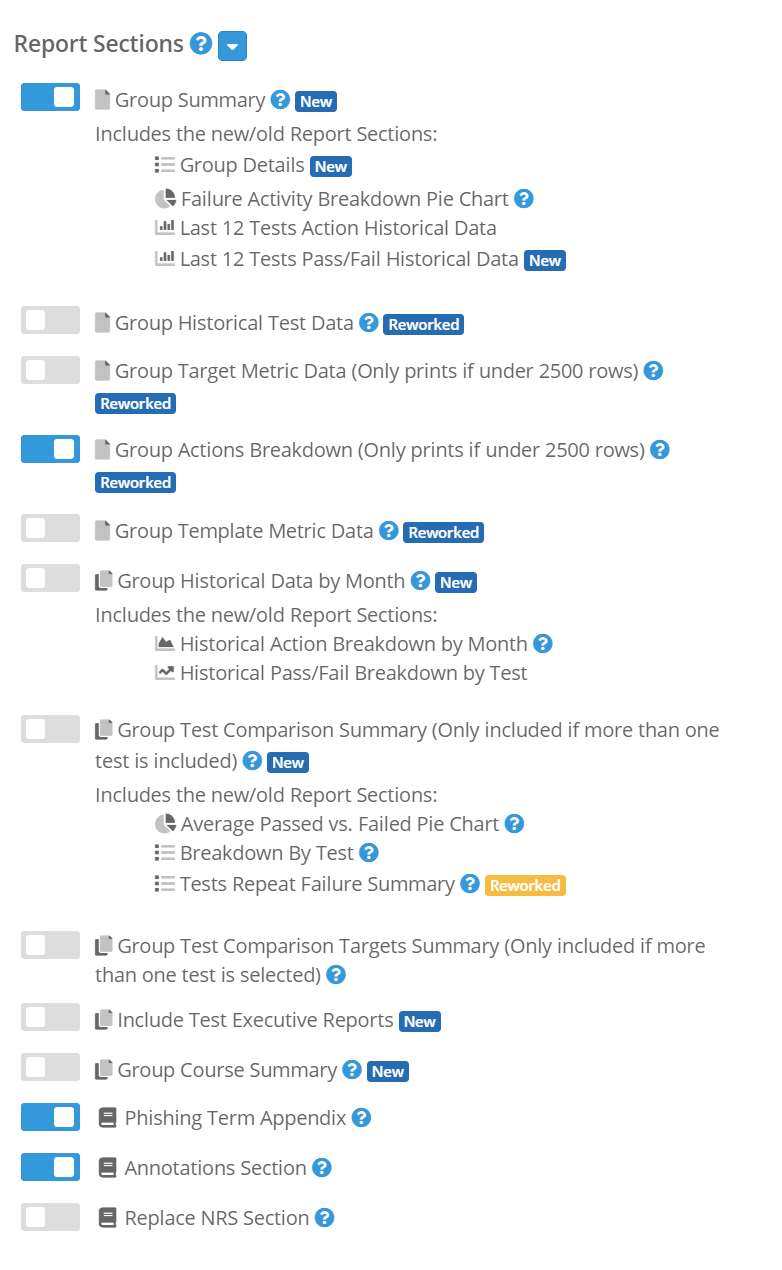
- Group Summary - This section gives a brief summary of the data for each test included. Also includes a failure activity pie chart which is broke down into failure percentages of all failure actions. Here if a user clicks a link 3 times for example, all 3 clicks will be counted.
- Group Historical Test Data - This gives a historical summary of all the data for each of the tests included.
- Group Target Metric Data (Only prints if under 2500 rows) - This summary gives a brief summary of the metric data for each target in the group.
- Group Actions Breakdown (Only prints if under 2500 rows) - This section lists all the actions for the group in a tabular format.
- Group Template Metric Data - This summary gives a brief summary of the metric data for each template.
- Group Historical data by Month - This section gives a brief historical summary of the data for each test broken down monthly.
- Group Test Comparison Summary (Only included if more than one test is included) - Gives a breakdown of each of the tests for the group for comparison. Gives average fail rate graphs and most severe action for all tests graph.
- Group Test Comparison Targets Summary (Only included if more than one test is selected) - Gives a breakdown of each of the tests for the groups targets for comparison.
- Include Test Executive Reports - This section gives a summary of the most severe actions and pass fail data.
By Group Repeat Offender
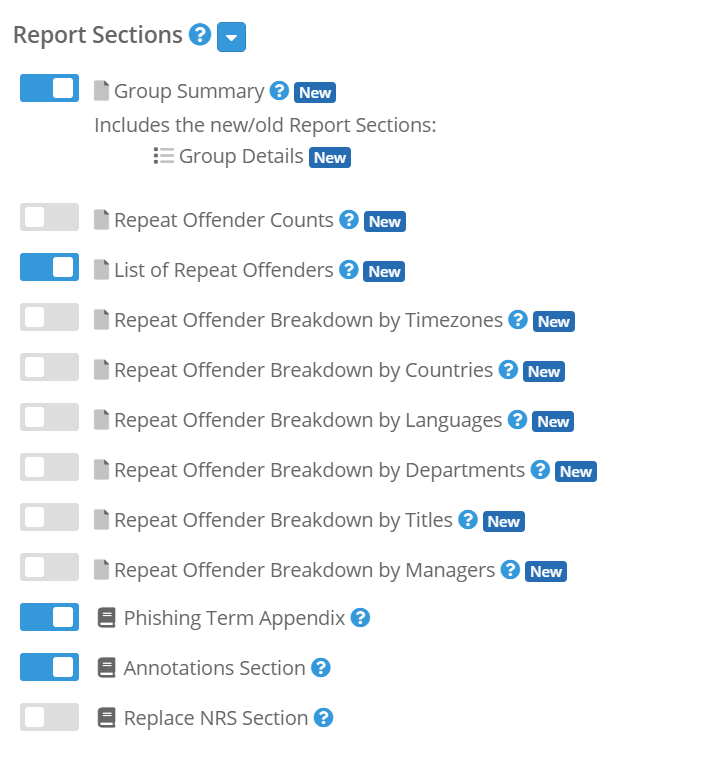
- Group Summary - This section gives a brief summary of the data for each test included. Also includes a failure activity pie chart which is broke down into failure percentages of all failure actions. Here if a user clicks a link 3 times for example, all 3 clicks will be counted.
- Repeat Offender Counts - This section breaks down the targets who have failed by the number of failures for the target.
- List of Repeat Offender Counts This section lists the repeat offenders for the group.
- Repeat Offender Breakdown by Time zones - Generates a bar chart to break down the repeat offenders by time zone.
- Repeat Offender Breakdown by Countries - Generates a bar chart to break down the repeat offenders by countries.
- Repeat Offender Breakdown by Languages - Generates a bar chart to break down the repeat offenders by languages.
- Repeat Offender Breakdown by Departments - Generates a bar chart to break down the repeat offenders by the targets department
- Repeat Offender Breakdown by Titles - Generates a bar chart to break down the repeat offenders by titles
- Repeat Offender Breakdown by Managers - Generates a bar chart to break down the repeat offenders for account managers
By Target

- Target Summary - This section breaks down the targets data into a summary including a pass vs fail comparison, most severe actions chart, target data by test, action table for each target, the targets IP map and summary (An example IP map is shown below).

- Target Course Summary - This section gives a brief summary of the course enrollments for the targets. Only use this option if the report will contain 25 or fewer targets.
By Template
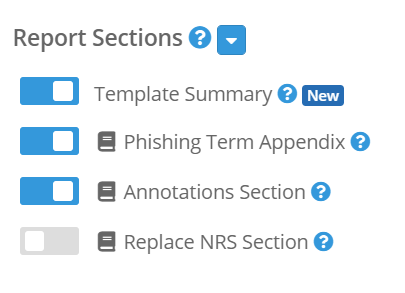
- Template Summary - This section gives a brief summary of data associated with the selected template
By Test
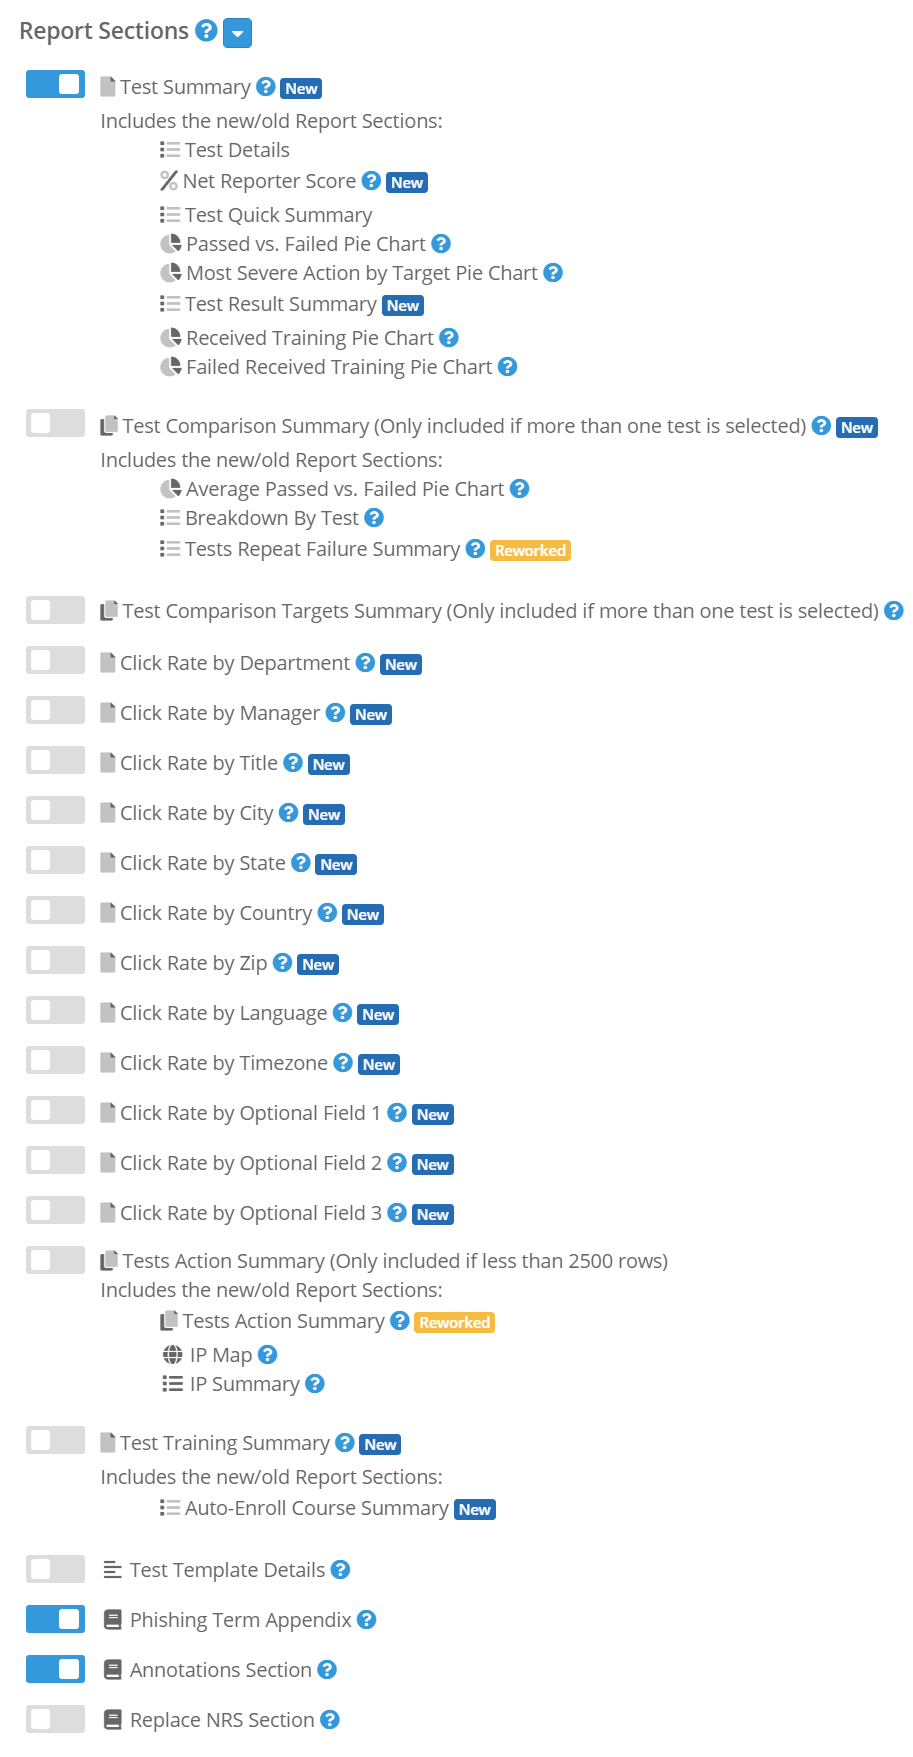
- Test Summary - This section gives a summary for each of the included tests
- Test Comparison Summary - This section gives a summary of each of the included tests in a format which compares the results of the tests against each other and in total
- Test Comparison Targets Summary - This section breaks down the testing data at target level for selected tests.
- Click Rate by ... - These sections will break down the targets click rate by the filtered selection
- Test Action Summary (Only included if less than 2500 rows) - This section will display the targets test actions in a tabular format
- Test Training Summary - Includes auto enrollment data for each test
- Test Template Details - This section gives the setup details for each template in the test
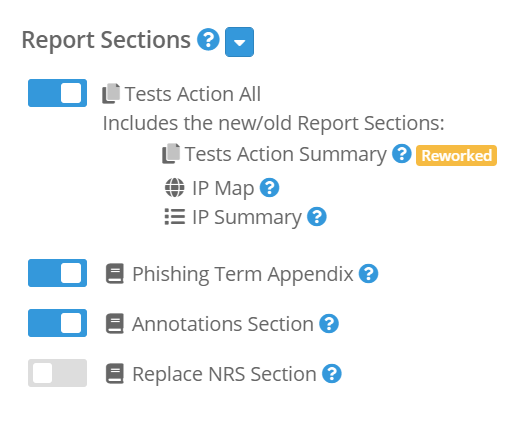
- Actions Report - Test Action All - This section breaks down the actions for each target in the test
Filters
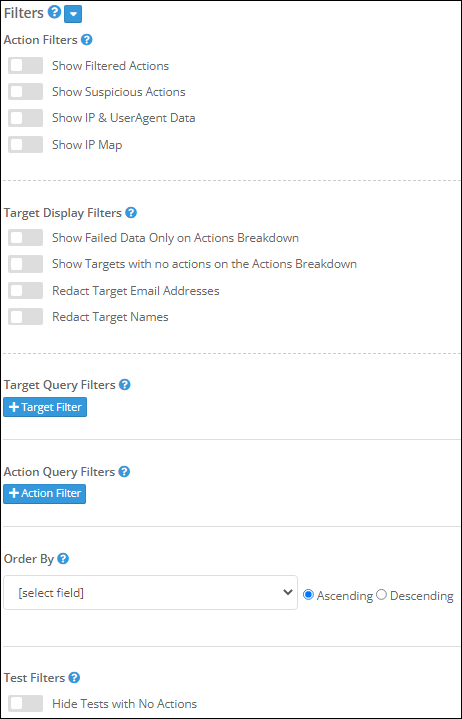
These options allow you to filter the pulled data according to your needs.
Action Filters
This section allows you to include/exclude certain information related to the actions performed by your targets.
- Show Filtered Actions allows you to display the actions filtered out. (Note: Displaying these actions does not cause them to be counted.)
- Show Suspicious Actions allows you to display the suspicious actions (i.e., actions neither verified or filtered). Displaying these actions does not cause them to be counted.
- Show IP & User Agent Data allows you to turn on/off the IP address, the coordinate data, and user agent information for the user’s actions.
- Show IP Map allows you to turn on/off the map showing where the various IP addresses are located.
Target Display Filters
This section allows you to include/exclude certain information related to targets.
- Show Failed Data Only on Actions Breakdown will only allow the report to include fail actions in an included actions breakdown.
- Redact Target Email Addresses allows you to hide the email addresses of your targets in the report. For security reasons, this is advised for sending via email.
- Redact Target Names allows you to hide the names of your targets in the report. For security reasons, this is advised for sending via email.
Target Query Filters
Target query filters allow you to customize the data pulling queries to include/exclude matching your criteria. You can choose from any of the pre-defined target fields and any custom fields you have created. For example, if you only wanted to show actions for targets in the engineering department, then you'd enter a target query filter like this:
Note: The "Active" filter - requires you to enter either 1 (to filter by active targets) or 0 (to filter by inactive targets).
Action Query Filters
The action query filters drop-down lets you filter the actions breakdown table by action type (actions of certain types can be included/excluded from the table).
Order By
The order by drop-down lets you to order tables (Actions Breakdown table, enrollments table, Target Metric Data table, etc.) ascending/descending by target fields.
Test Filters
- Hide Test with No Actions allows you to hide tests that have no actions from displayed data. This only affects the data displayed, not the analysis data.
Custom Fields
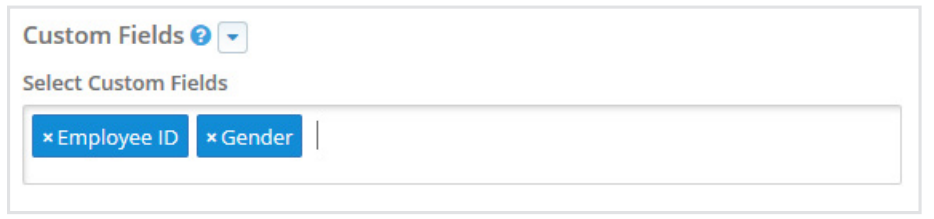
This drop-down allows you to add any of your custom field data to the target rows in the report. For spacing reasons, it is advised to not add more than 5 fields. The custom fields will only appear on the Actions table.
Collate
The Collate option becomes visible when running By Campaign > Summary Report w/ Executive Reports. This option will allow you to download a zip file of all the test executive reports for a campaign. The Save PDF button will become a Save Zip button, and the Email PDF button will become an Email Zip button.
Save Custom Options
Enable the 'Save Custom Options' switch to save a custom report style. If you chose a report type and enabled or disabled report sections and enabled 'Save Custom Options', the report sections and filters will be saved and be accessible at a later date. You will find any saved reports in the 'Select Report' drop-down select menu, and you can manage custom reports on the Manage Custom Reports page.
Post-Report Generation Options
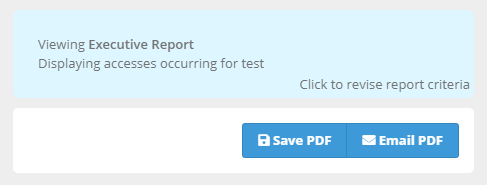
Once your report has been generated the top of the screen will contain some basic data for your review.
Report and Revision Options
The blue area gives basic information about the type of report you generated and a link to re-open and revise the form creation criteria.
Saving Your Data
There are two options for retrieving the report from the system.
- Save PDF will save the report as a PDF for you to download or view in your browser.
- Email PDF allows you to send the report to anyone you want directly from the system.
A Note About Flattened Data
On some reports you may notice an asterisk (*) beside the number, such as in the screenshots below.

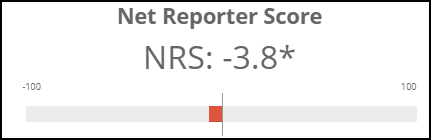
This just means that there was at least one target whose data has been "flattened" on the test or campaign. Some targets are counted in multiple tests/groups, but only one phishing email was actually sent to the target.